The patient record
Each patient record is organized into six tabs. Trends and Care Plan list their record types down the left — pick one and the detail opens in place.
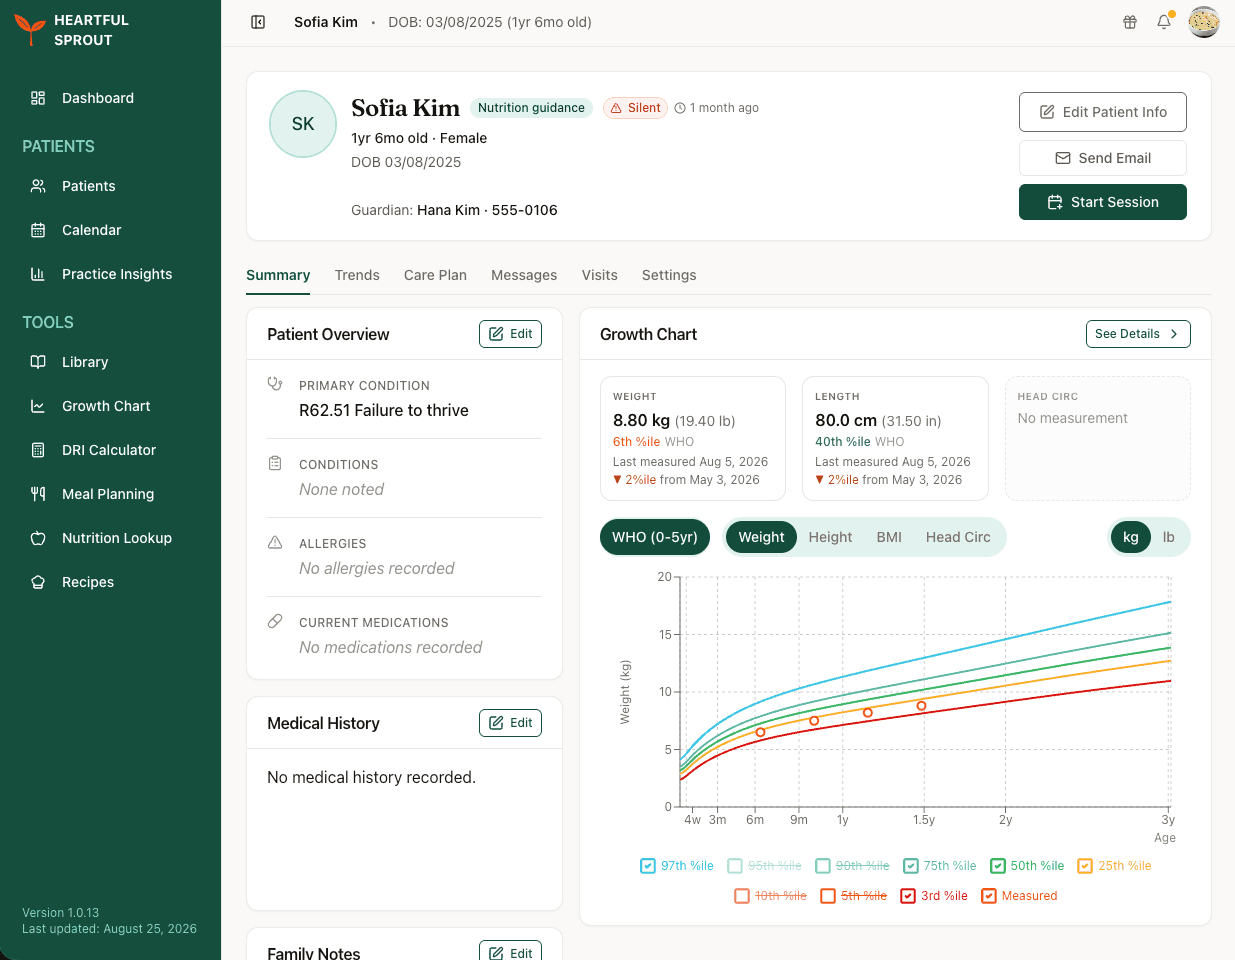
The six tabs
| Tab | Inside | Use it to… |
|---|---|---|
| Summary | Patient Info, Medical History, Family Notes, Documents, Snapshot, Growth Chart, Nutrition cards; Safety Flags detail | Scan the at-a-glance picture before a session |
| Trends | Growth · Nutrition · Infant Tracking · Milestones · Eating Recovery | Review what the family has been logging between visits |
| Care Plan | Recovery Plan · Surveys · Drivers · Routines · Food Hierarchy · Handouts · Goals · Meal Plans · Nutrition Goal · Vaccines | Manage everything you prescribe or assign to the family |
| Messages | One thread per connected app | Message the caregiver — they read and reply in their patient app |
| Visits | Sessions & Appointments + a month calendar | Start, resume, or review sessions; see synced appointments |
| Settings | Patient Status, Onboarding, Program Access, Registration Info, Chart Setup | Manage status, invites, apps, and which records this chart shows |
How Trends and Care Plan are laid out
Both of these tabs list the record types down the left. Pick one and its detail opens beside it, so you can move between growth, nutrition, and tracking without leaving the tab.
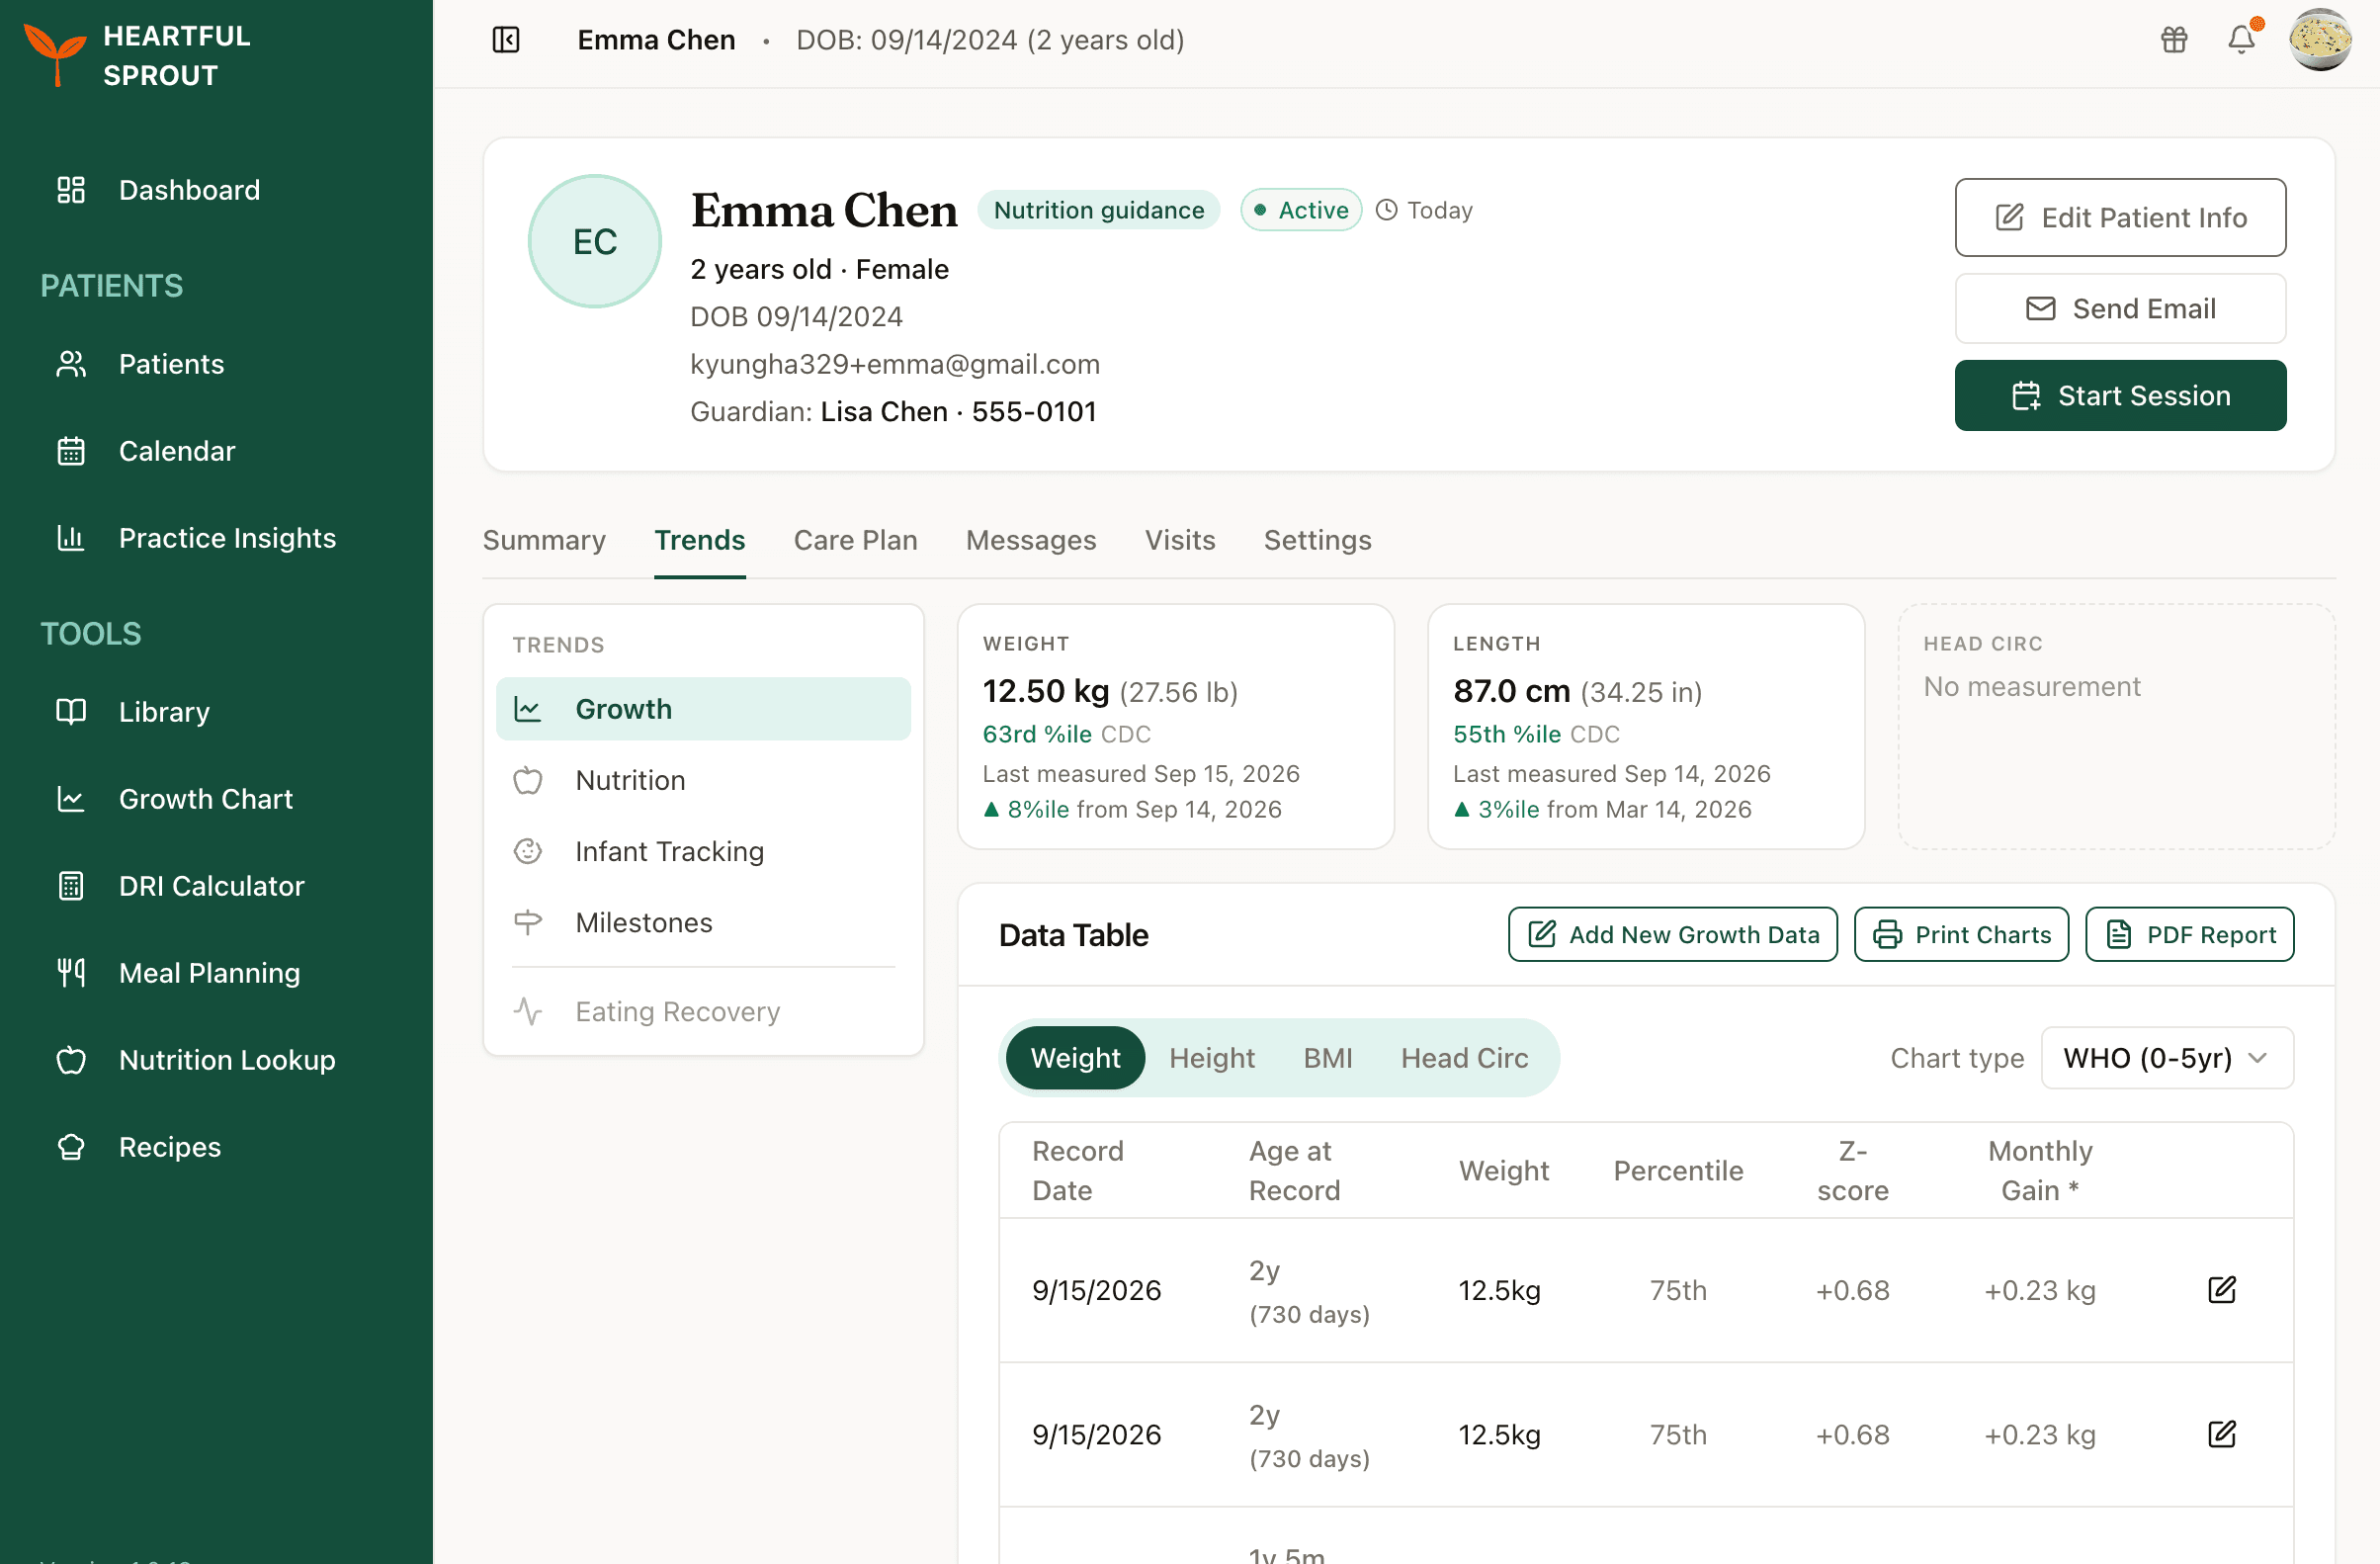
A record the family has no app for is greyed out in that list, as Eating Recovery is here. Growth adds summary tiles for weight, length, and head circumference above the data table, each showing the latest measurement, its percentile, when it was taken, and the change since the previous one.
Reading the header
- Program chips show which programs are on (Nutrition guidance, Infant tracking, Eating recovery), next to an engagement badge and last-activity time.
- Demographics line: age · sex · DOB · gestational age (if preterm), plus the registered email and guardian contacts (expand with More).
- Action buttons: Edit Patient Info, Send Email, Start Session.
- Badge pills mark unread Messages and open safety flags on Summary.
Where the data comes from
Detail views print a provenance line — e.g. "Synced from the Heartful Baby app" — so you always know which app supplied the data. If a record shows an empty state pointing to Program Access, the family isn't set up with the app that feeds it. See Manage access.
Common workflows
- Pre-session prep — Summary → Snapshot → Trends for recent logs.
- Resume a draft — Visits → click the in-progress session.
- Tune the chart — Settings → Chart Setup toggles sections (growth, milestones, vaccines, sessions) and Summary cards per patient. See Per-patient chart setup.
Deep-linking: every tab has a stable URL (
?tab=trends,?tab=care-plan, …) — handy for bookmarks.
The snapshot panel
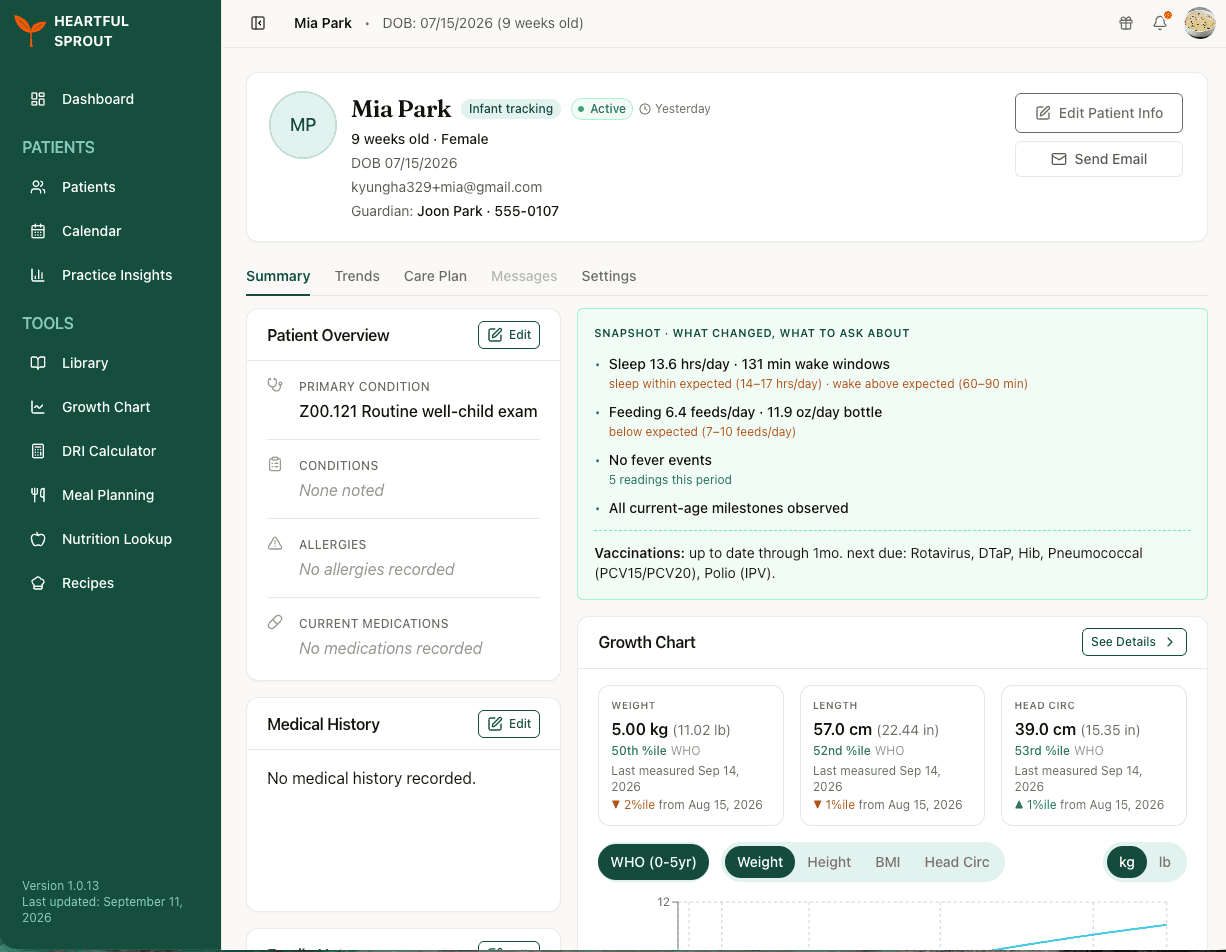
The snapshot sits on the patient's Summary tab and answers one question: what changed since you last looked, and what should you ask about. It is generated from the family's logs, so it is already waiting when you open the record. Start a review here.
How to read it
Each bullet pairs a measured value with a plain-language verdict against age-appropriate norms, so you can see both the number and whether it matters.
Sleep 13.6 hrs/day · 131 min wake windows sleep within expected (14–17 hrs/day) · wake above expected (60–90 min)
The verdict line is the useful part. A feeding rate of 6.4 feeds a day means little on its own, and a great deal when the panel tells you the expected range is 7 to 10.
Where nothing is out of range, the bullet says so plainly, such as no fever events or all current-age milestones observed. A short panel is a reassuring result, not a missing one.
What it covers
- Safety flags needing review, which lead the panel when present
- Sleep, including total hours and wake windows
- Feeding, including rate and volume
- Temperature episodes, and how many readings the period contained
- Milestone progression for the child's current age
- A vaccination line naming what they are up to date through and what is due next
Growth and diaper detail are not summarised here. They have their own records: Growth and Infant Tracking.
What "expected" means, and what it does not
The ranges behind those verdicts are age-banded reference values drawn from published guidance: AAP guidance for feeding and elimination, and WHO and CDC recommendations for sleep. They are deliberately conservative, written to answer whether a value sits in the normal zone.
These are not diagnostic thresholds. The snapshot does not diagnose, recommend treatment, or replace your judgement. A value outside the range is a prompt to look. A value inside it rules nothing out. Your assessment of the child in front of you governs, not the label on the bullet.
Treat the panel as 30-second triage that tells you which record to open, then read that record. The vaccination line, for instance, summarises Care Plan → Vaccines, where the per-dose detail lives.
Per-patient chart setup
Tailor each patient's chart to the care you provide. Per-patient overrides sit on top of organization-level defaults.
Where to set this
Patient record → Settings → Chart Setup.
Sections you can toggle
Sections turned off show "Not in this chart":
| Section | Lives in |
|---|---|
| Growth | Trends |
| Milestones | Trends |
| Vaccines | Care Plan |
| Sessions | Visits |
Presets get you there fast: Infant, Nutrition, Eating Recovery, or Everything.
App-tied records — Nutrition, Meal Plans, Infant Tracking, Eating Recovery — don't use these toggles. They appear based on Program Access and whether the family has logged data.
Summary layout
Cards you can show or hide on the Summary tab:
- Patient Info
- Medical History
- Family Notes
- Documents
- Snapshot
- Growth Chart
- Nutrition
How defaults cascade
Platform defaults
  → Organization defaults (Settings → Layout Customization)
    → Your Caseload & Focus answers
      → Per-patient Chart Setup (always wins)
Organization defaults: Layout customization. Your personal defaults: Caseload & Focus.
The same Settings tab also controls onboarding requirements and program access — see When a family stalls.