Reading the growth curve
Trends → Growth plots every measurement on a reference chart with percentiles and z-scores.
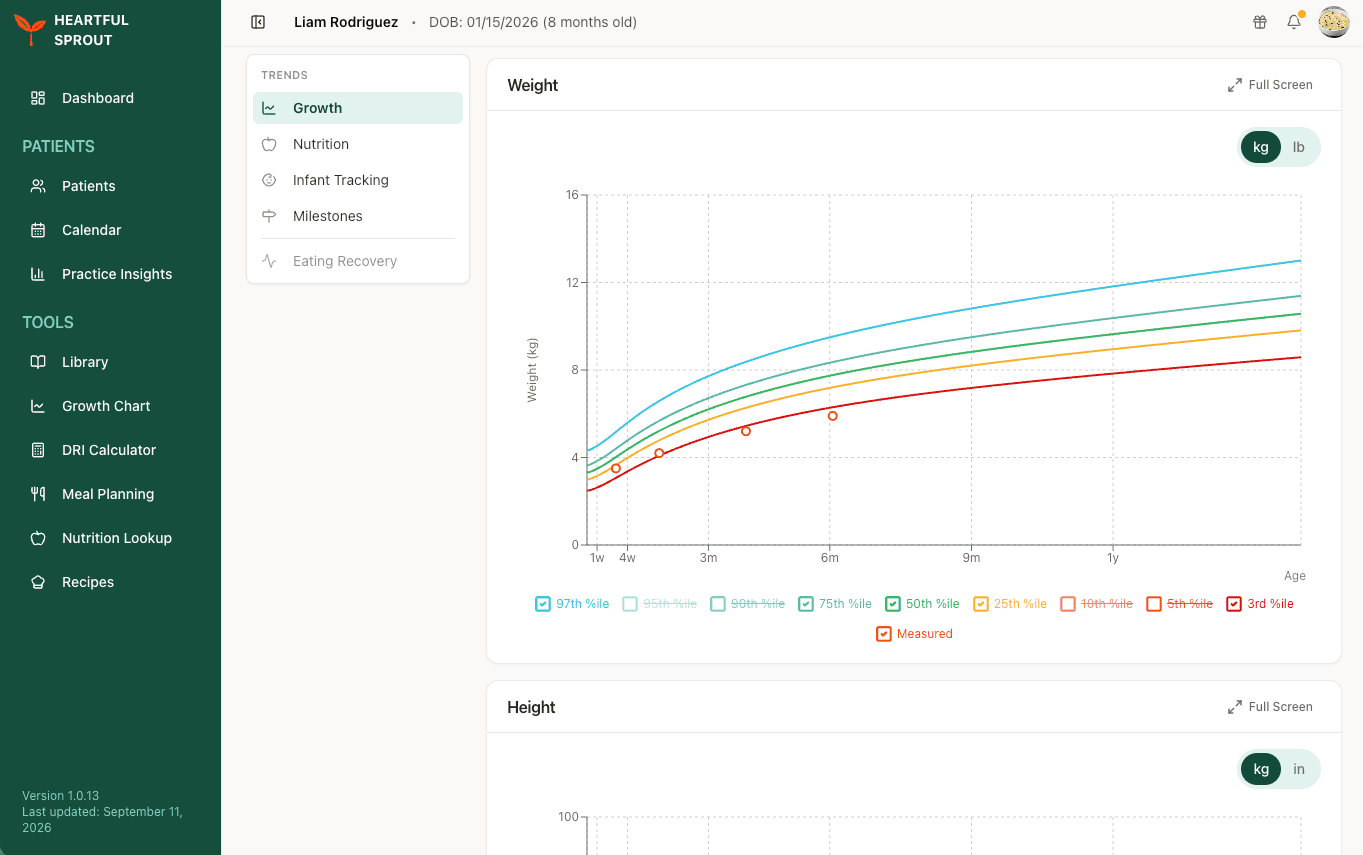
Each metric gets its own chart, stacked down the tab: weight, height, BMI, and head circumference. Toggle units between kg and lb per chart, open any chart Full Screen, and switch individual percentile bands on or off from the legend so the curve you care about is not lost in the others.
Reference selection
You pick the chart; WHO is the default and switching is manual.
| Reference | Use for |
|---|---|
| WHO (0-5 years) | Infants and toddlers (most pediatric guidelines use WHO here) |
| CDC (2-20 years) | Older children and teens |
| Fenton (preterm) | Preterm growth on the Fenton 2025 reference |
Corrected age
For patients with a recorded gestational age, a Corrected age toggle appears on WHO and CDC charts (Fenton already plots by postmenstrual age). Chronological age is the default; flip the toggle to compare.
The data table
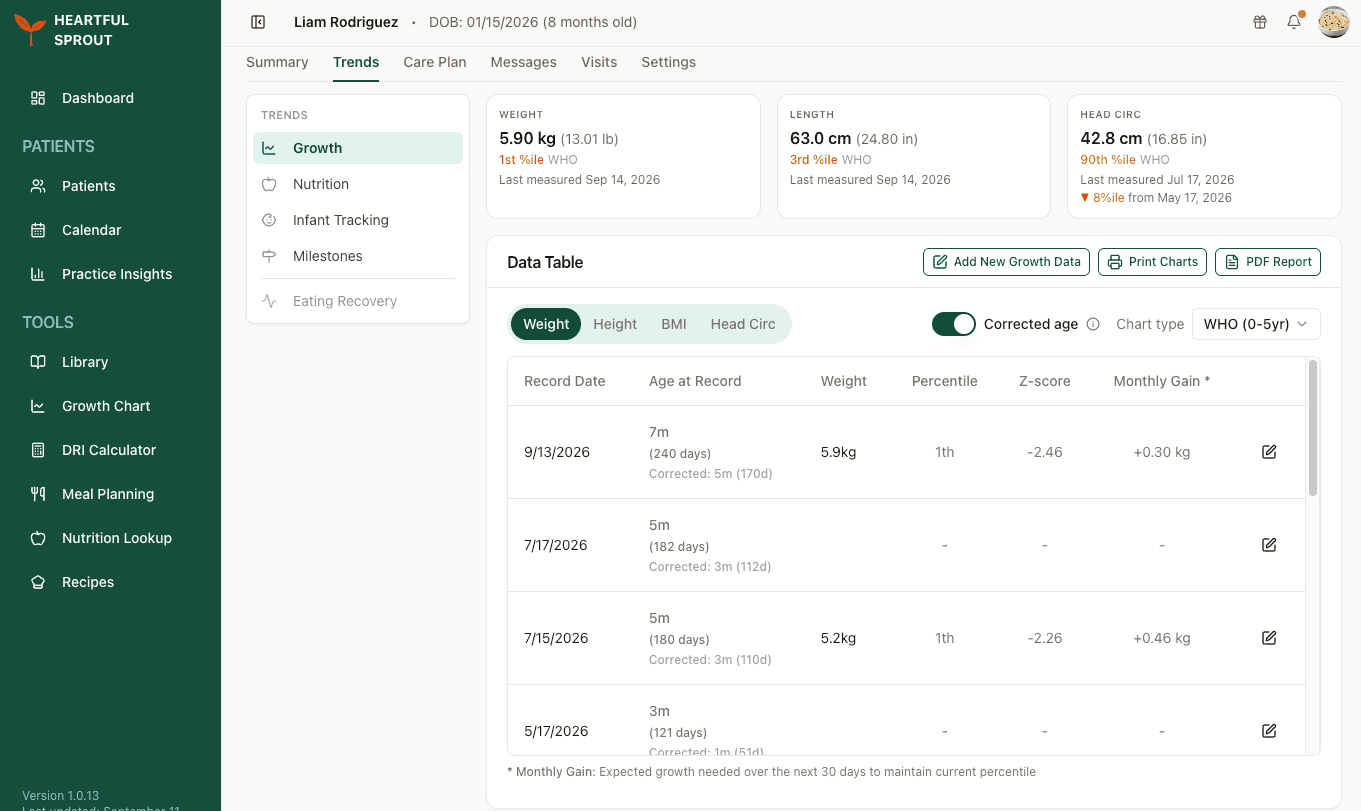
Under the charts, the same measurements appear as a table, one row per record.
| Column | What it tells you |
|---|---|
| Age at Record | Chronological age, with corrected age underneath when the patient is preterm |
| Percentile and Z-score | Where that measurement fell on the selected reference |
| Monthly Gain | The growth needed over the next 30 days to hold the current percentile |
Rows the family logged without a measurement show dashes rather than zeros. Use Add New Growth Data to record a measurement yourself, the pencil on any row to correct one, and Print Charts or PDF Report to take the charts out of the platform.
What to look for
- Sustained percentile drops across visits
- Crossing two major percentile bands (e.g., P50 → P25 → P10)
- Discordance between weight and height curves
- Z-score trends rather than absolute percentile
Print & share
Two exports on the same tab:
- Print Charts: print-ready layout with the patient header and the weight, height, BMI, and head-circumference charts (as applicable), page breaks between charts. Use the browser dialog to save as PDF.
- PDF Report: a generated growth report document.
Useful for printed visit summaries, faxing a referring provider, or paper charts.